My understanding of Beautiful News‘ purpose is to publish articles in a graphic format meant to be beautiful in meaning and presentation. I’ll agree the presentation is beautiful. But the content often seems off. And it’s often recycled from who-knows-when.
The purpose of this piece is to comment on what seems to be their habits. The sample article happens to be about electric vehicles. This piece is not arguing for or against electric vehicles, only BN’s presentation.
Today, they had a graphic entitled, “California is Driving the EV Revolution“. (It was on their Home page at about 8:00 PDT but it went missing by 11:00 PDT.) They indicate they’re reporting on electric vehicles sold based on data from the US Department of Energy and an ars Technica article (which is dated 2018!). Unfortunately, they give no time frame nor an exact meaning of “electric vehicles sold”. All-electric only? Hybrids? Plug-in hybrids? Sold when? Sold where? I’ll take “electric” and “EV” as electric-only vehicles. Because a corner note on their graphic mentions 175,000 for the “Rest of the USA” I’ll presume they’re counting US sales.
They show us eighteen states with numbers of EVs sold from California’s 180,000 down to Ohio’s 3,800. The rest of the states are represented solely by bubbles sized in proportion to their counts. All BN’s numbers are woefully low. I won’t reproduce their graphic here due to presumed copyright protection. Their graph is here and an archive of it is here. Their data can be graphed, less beautifully than they did, as the brown (bottom) line on this graph.
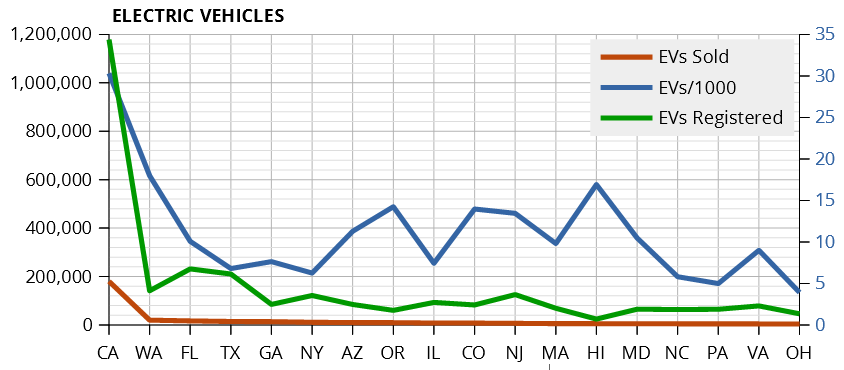
I don’t know what US Department of Energy data they used. When I looked there, I found registered EVs by state. California was at 1.1 million. If BN used 2018 data (as the ars Technica piece was dated), the understatement is understandable: EVs have made great strides in sales since 2018. On the other hand, perhaps it was published in 2022. The Wayback Machine first captured it in July, 2022.
The green (middle) line is based on much more recent data. The BN line decreases as it heads from California to Ohio. More recent data shows unevenness. Apparently, states such as Washington and Georgia have flagged in their adoption of EVs while other places have zoomed.
Too, when it comes to adoption, perhaps per capita numbers are more interesting. After all, with a whole-state population around 600,000, we can’t expect Vermont to have a million EVs, or even 180,000.
Things get rather interesting in comparison to BN’s take. California and Washington are still ranked 1 and 2. But Hawaii is a very close 3rd instead of 13th. Oregon is 4th instead of 8th. Colorado is 5th instead of 10th. On the other end, Ohio is 34th instead of 18th. Three of the top 10 weren’t even highlighted in BN’s piece: Nevada at 6th, Vermont at 8th, and DC at 10th.
With the right tools and a clever mind, anyone can graph numbers. Beautiful News shows beautiful things but they should take more care in the meaning of what they show and date what they recycle.
edited 27Jun24
added purpose of this piece in opening